How to read temperature mapping data
Defrost cycles vs. real problems

Jakob Konradsen
Temperature excursions in your mapping data do not always signal problems. Some patterns are expected system behavior. Others indicate risks that require action. Stop wasting time investigating false alarms in your data. Learn to identify normal patterns like defrost cycles and door openings from compliance issues.

Table of contents
Note!
This article is based on insights from the book "Mastering Temperature Mapping" by Jakob Konradsen, Chief Quality Officer at Eupry. For the complete methodology behind risk-based facility qualification, sign up to get notified when the book launches.

Why do pattern recognition matter in mapping data analysis?
Correctly reading temperature data patterns directly impacts your validation efficiency and audit readiness.
An important part of data analysis is to identify relevant tendencies in the data (...) In any case, it is important to be able to explain, or at least give a probable cause, for any tendencies observed during the study, as any unexplained tendencies could be an indication of an issue that will impact the thermal performance over time or simply make the results of the study invalid.
Jakob Konradsen, *Mastering Temperature Mapping"
When you can quickly distinguish normal system behavior from actual compliance risks, you gain:
- Investigation efficiency: Focus your time on actual risks rather than normal system behavior.
- Audit preparedness: Demonstrate to auditors that you understand your system's behavior and can distinguish expected patterns from true deviations.
- Operational reliability: Set realistic procedures based on actual system capabilities rather than assumptions.
- Documentation accuracy: Your mapping report must explain temperature patterns with probable causes to withstand regulatory scrutiny.
Also read: Temperature mapping: Tips, frameworks, and pitfalls
What can cause regular temperature spikes in my mapping data?
Repeating temperature rises at regular intervals – typically every 6 to 12 hours – are usually defrost cycles, not compliance issues.
Defrost cycles are defined by a repeating interval of temperature rises, often with the same interval between each rise in temperature, typically every 6 to 12 hours. Defrosting is a feature of cold or frozen units implemented in order to ensure that frost does not build up on the evaporator or the interior of a piece of equipment.
Jakob Konradsen, *Mastering Temperature Mapping"
How to identify defrost cycles
When reviewing your temperature data, look for these four telltale characteristics that distinguish defrost cycles from equipment problems:
- Regular intervals: Spikes occur at consistent time intervals (commonly 6, 8, or 12 hours)
- Similar magnitude: Each temperature rise reaches approximately the same peak
- Quick recovery: Temperature returns to normal range within a predictable timeframe
- Multiple sensors affected: The pattern appears across several measurement locations simultaneously
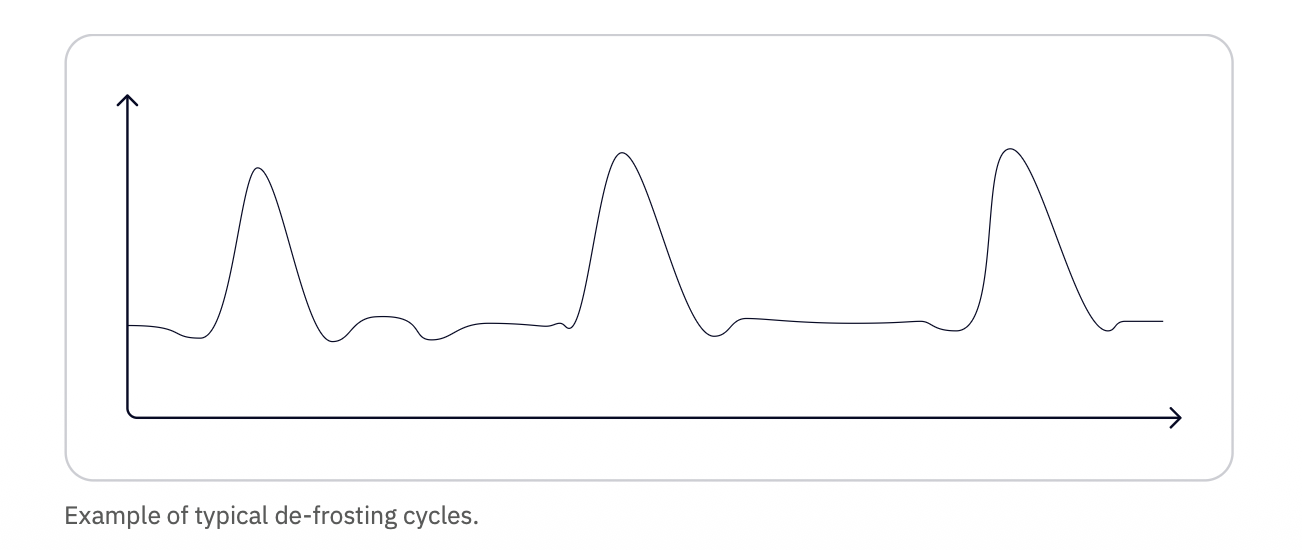 Temperature data showing regular defrost cycles at consistent intervals. Each spike reaches a similar peak temperature before returning to baseline.
What to verify
Defrost cycles are normal system operation, but you should verify:
- The temperature increase stays within acceptable limits (including any allowed excursion criteria)
- Product temperature remains compliant during defrost (using sensors placed inside the simulated product)
- The pattern is consistent and predictable across mapping studies
Documenting defrost cycles
Your mapping report should identify defrost cycles as an observed tendency and include:
- The interval between cycles
- Peak temperature reached during defrost
- Recovery time to baseline
- Impact assessment on acceptance criteria compliance
This documentation demonstrates to auditors that you recognized the pattern, understood its cause, and verified it does not compromise product quality.

Download a mapping report template
Develop a cohesive and actionable GxP temperature mapping report with this detailed report template including practical examples.
What causes stable temperature drifts – and when to worry?
Stable drift shows as a gradual, steady temperature change over time. It may be normal or may signal issues depending on the cause and magnitude.
"Stable drift of temperatures shows by a steady increase or decrease in temperature, and can be caused by a series of different reasons. Stable drift is identified by the average temperature slowly changing over time, but with shorter or longer periods of apparently stable temperatures."
Jakob Konradsen, *Mastering Temperature Mapping"
Three common causes
1. External temperature changes
Surrounding environment temperature affects your controlled space, particularly for facilities with walls facing outdoor environments or rooms adjacent to non-climate-controlled areas. This type of drift is often expected and should be accounted for through seasonal studies.
2. Temperature control system settling
New equipment or systems require time to reach steady-state operation after startup. This is normal for initial mappings, but should not appear in routine operations or re-mappings of established equipment.
3. Control sensor drift over time
Control sensors can drift away from accurate readings over months or years, causing the system to maintain temperatures different from the setpoint. This requires investigation and typically indicates a need for control sensor calibration or replacement.
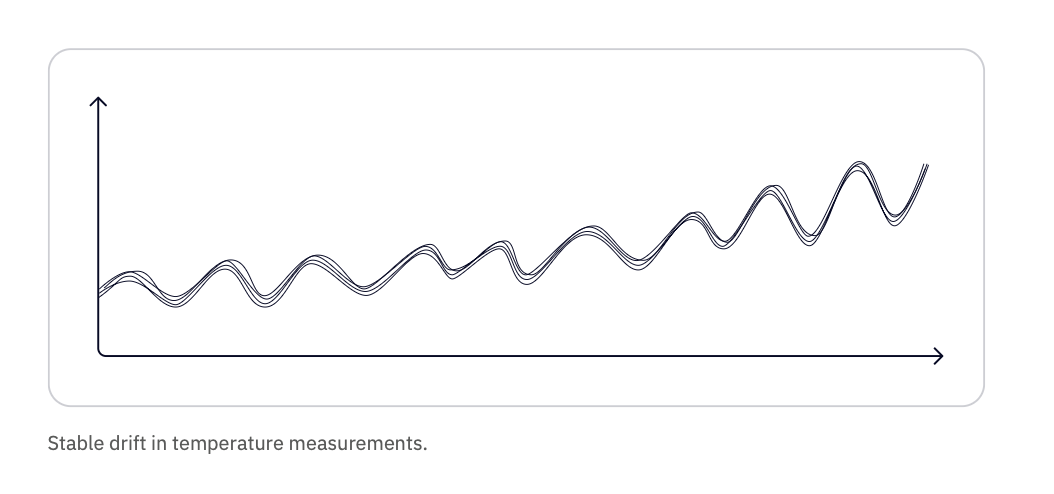 Temperature data showing a gradual upward drift over time. The average temperature steadily increases while maintaining short-term fluctuations.
When drift requires action
Investigate stable drift when:
- Average temperatures approach acceptance limits
- The drift rate suggests out-of-specification conditions are imminent
- Drift appears during re-mapping of previously stable equipment
- No expected external factors explain the pattern
Document your analysis in the mapping report with probable cause and any recommended corrective actions.
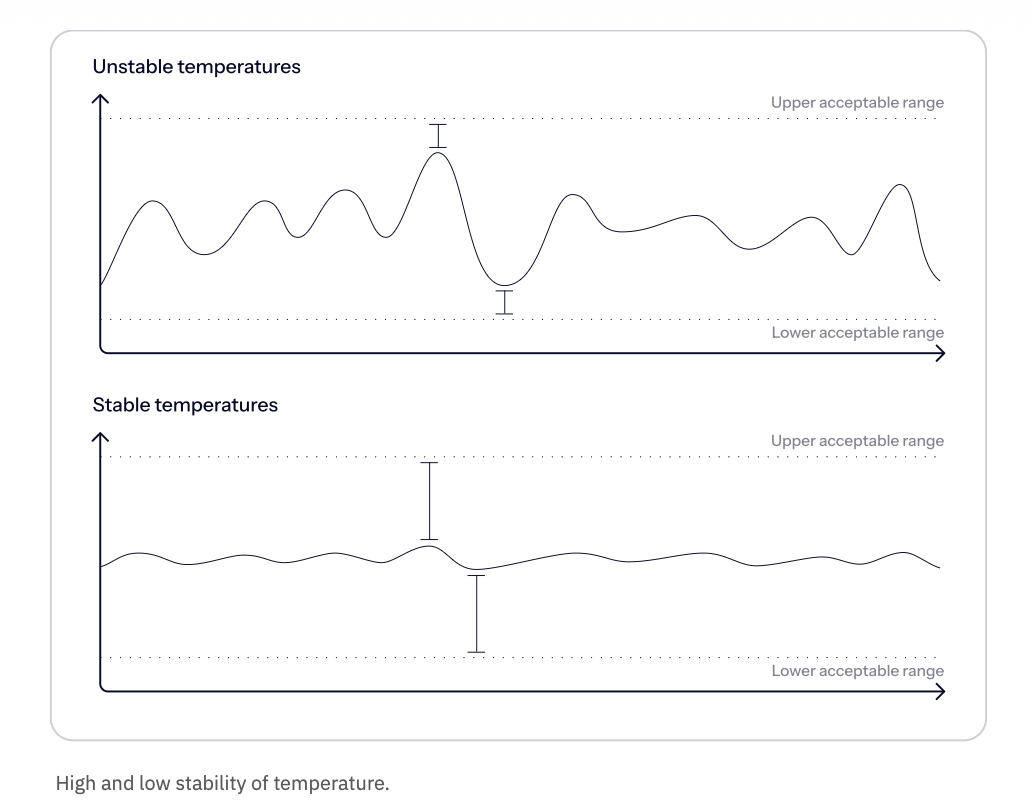 Unstable temperatures (top) require investigation, while stable temperatures (bottom) indicate controlled conditions within acceptable limits.
What should door opening patterns look like in mapping data?
Door openings create temperature increases that should return to baseline before the next opening. Accumulated effects indicate insufficient recovery time.
Door opening studies are required by all major guidelines (EU GDP, USP <1079>, WHO TRS 961, ISPE) to demonstrate that facilities can handle operational conditions without compromising product temperature.
Also see: What are the WHO’s guidelines for temperature mapping?
Normal door opening pattern
A controlled door opening test shows:
- Rapid temperature increase as ambient air enters
- Peak temperature at or shortly after door closure
- Recovery period where temperature returns toward baseline
- Stabilization back to normal operating range before the next opening
Accumulated door opening effect
When door openings occur too frequently, the temperature may not fully stabilize between events. Each subsequent opening builds on residual temperature elevation from previous openings.
This pattern indicates:
- The door opening frequency exceeds what the system can handle
- Increased risk of temperatures exceeding acceptable limits
- Need to revise operational procedures or door opening schedules
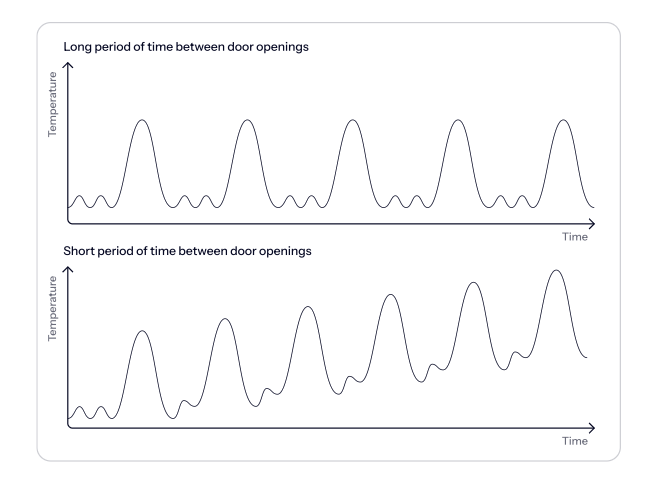 Temperature patterns showing adequate recovery time (top) versus accumulated door opening effect (bottom).
Using door opening data for operational guidelines
Your mapping report should translate door-opening test results into practical operational limits. For example:
- Maximum door opening duration: 60 seconds
- Minimum time between openings: 20 minutes
- Maximum consecutive openings: 3 within a 1-hour period
These recommendations guide daily operations and help prevent compliance issues before they occur.
What to do when you can’t identify the pattern
Temperature data sometimes shows unexpected or unclear patterns. When you cannot confidently identify the cause:
Finding the root cause of a specific tendency requires an analysis of the temperature profiles, and can often be aided by the use of other data gathered during the study, such as entry logs or other information on the usage of the facility or equipment during the study.
Jakob Konradsen, *Mastering Temperature Mapping"
Work through these investigation steps systematically:
- Review operational logs: Check for door openings, equipment maintenance, or other events during the study period
- Check adjacent spaces: Verify temperature conditions in surrounding areas
- Consult equipment documentation: Review manufacturer specifications for normal operating characteristics
- Consider extended monitoring: Collect additional data over a longer period to reveal trends
Document any unexplained tendencies in your mapping report, together with a risk assessment of their potential impact on study conclusions. An unexplained tendency could indicate equipment performance issues, operational disruptions, external factors not accounted for in the protocol, or data logger malfunction.
Do not dismiss unexplained patterns. Either identify the cause or perform additional studies to ensure valid conclusions.

Download a mapping protocol template
Get an practical framework for planning your mapping - including acceptance criteria, sensor placement, test duration, and much more.
How do you apply this knowledge to your mapping studies?
Use pattern recognition at three stages:
During execution: Real-time monitoring helps catch issues early. If you see unexpected patterns during data collection, investigate immediately while conditions are fresh.
During analysis: Apply pattern knowledge when reviewing data for your mapping report. Identify and document all significant patterns with probable causes.
During protocol development: Anticipate expected patterns based on equipment type and operational plans. Your protocol should include acceptance criteria that account for normal variations like defrost cycles.
Strong mapping reports identify all significant temperature patterns, provide probable causes for each pattern, assess whether patterns represent normal operation or risks, and document investigation steps for any unclear patterns. This demonstrates system understanding to auditors.
How long should you collect data to identify patterns?
The required data collection period depends on the patterns you need to capture.
Standard stability studies:
- Standalone equipment: 24 hours (typically captures multiple defrost cycles)
- Facilities: 7 days (captures weekly operational patterns and multiple defrost cycles)
Seasonal variations: Require either extended monitoring or multiple mapping studies across different seasons (summer and winter mappings).
If initial mapping data shows patterns that do not repeat consistently or fully reveal their characteristics within the standard study period, extend monitoring or schedule additional studies to gather sufficient data for conclusive analysis.
Frequently asked questions
Learn more about “Mastering Temperature Mapping”
One book. All the relevant guidelines. Real use cases.
Jakob Konradsen distills over a decade of mapping experience into methods you can use right away – from protocol writing to logger placement and reporting.
