Where to place data loggers during temperature mapping?

Jakob Konradsen

Optimal data logger placement for mapping – how and why is it important? Defining where to place loggers is a common challenge in temperature mapping. Learn best practices for sensor placement based on WHO and ISPE guidelines, and apply a risk-based approach to create a balanced GMP/GDP-compliant mapping plan.
Having too few or too many data loggers – or placing them in the wrong areas – are frequent issues in temperature mapping, and defining where to place loggers can seem complex.
Overdoing it wastes time and resources, and underdoing it can create gaps in data and compromise compliance and data integrity.
In this guide, we will walk through best practices for finding the right balance in data logger placement and amount, grounded in WHO and ISPE standards and built around a risk-based approach to avoid using more loggers than needed. Create a mapping strategy that aligns with GxP requirements, satisfies auditors, and reflects your environment and operation.
Also see: Temperature mapping: Tips, frameworks, and pitfalls
This article goes through:
- How WHO and ISPE define data logger placement for mapping
- Why data logger placement matters in temperature mapping
- 4 steps to define placement for your specific environment
- Video tutorial: Data logger placement for mapping
- Common mistakes to avoid in data logger placement
- FAQ about data logger placement in temperature mapping
Why data logger placement matters in temperature mapping
Sensor placement can directly shape the outcome of your study. A well-thought-out sensor strategy efficiently reveals risks or confirms your environment’s usability. No information gaps, overly complicated data, or wasted time or finances. A poorly scoped one can miss critical issues or create unnecessary data, wasting resources. Regulators expect your mapping to reflect the real conditions to which your products are exposed. That means your data loggers must cover the right zones, at the right heights, and with a clear logic that connects placement to risk.
But how do you create a strong, audit-ready placement plan for your mapping?
How WHO and ISPE define data logger placement for temperature mapping
Both WHO TRS 961 – Annex 9 and ISPE’s “Good Practice Guide: Controlled Temperature Chambers provide guidance on logger count and distribution. These are largely based on the French standard FD X15-140, which defines the geometric logic behind placement strategies.

WHO guidelines for data logger placement:
- One sensor every 10 square meters in small rooms
- One sensor every 30 square meters in larger spaces
- Placement at low, mid, and high points if the room is over 3 meters tall
- Focus on areas where products are stored, not just geometric coverage
ISPE recommendations for sensor distribution:
- Even distribution across the usable volume
- Extra attention to corners, center points, and volume extremes
- Three vertical layers (bottom, middle, top) in spaces above 3 meters
- Emphasis on combining geometric logic with operational risk
However, these are baselines, not definitive answers. Guidelines give you a starting number, but your actual requirements are shaped by real risk and operational conditions. The number of data loggers needed can also often be reduced significantly, without compromising compliance, by applying a risk-based approach.
Try our free data logger calculator based on WHO and ISPE guidelines →
Also read: How many data loggers do you need for temperature mapping in GxP?
Note: A practical rule of thumb is one logger every 10–30 meters in large environments, adjusted based on criticality and variability. However, the number alone is only part of the equation; placement quality is just as important.
4 steps to define data logger placement for mapping your specific environment
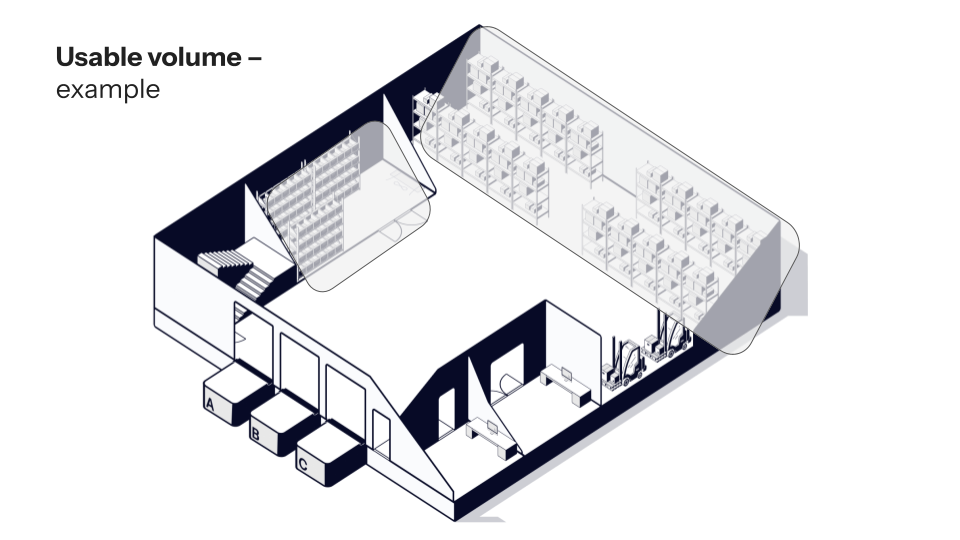
Define the usable volume
Compliance is about protecting products and samples, not measuring every cubic meter of air. Your mapping strategy should focus on the actual usable volume, not the full physical space.
The “usable volume” refers to the zones where temperature-sensitive goods are stored or staged, whether for long- or short-term durations.
This can include:
- Primary storage zones (racking, shelving, cold rooms)
- Temporary storage areas (like staging bays or buffer zones), if goods are placed there for a significant amount of time, whether consistently or occasionally
- Transit zones, if transfer time or sensitivity introduces a risk
Avoid mapping unused spaces. This helps focus your mapping on relevant areas, saving time and reducing unnecessary alerts from irrelevant data points.
Start with grid placement
Your first layer of loggers should cover the geometric boundaries of the usable volume.
- Place sensors in all corners of the mapped space.
- Add at least one in the center.
- Place sensors at the lowest and highest product exposure points (typically pallet height and top shelf).
- Add mid-height sensors as needed in environments taller than 3 meters.
General mapping standards suggest the following spacing: 10–30 meters between sensors in large rooms, 3–9 meters in smaller or more sensitive areas.
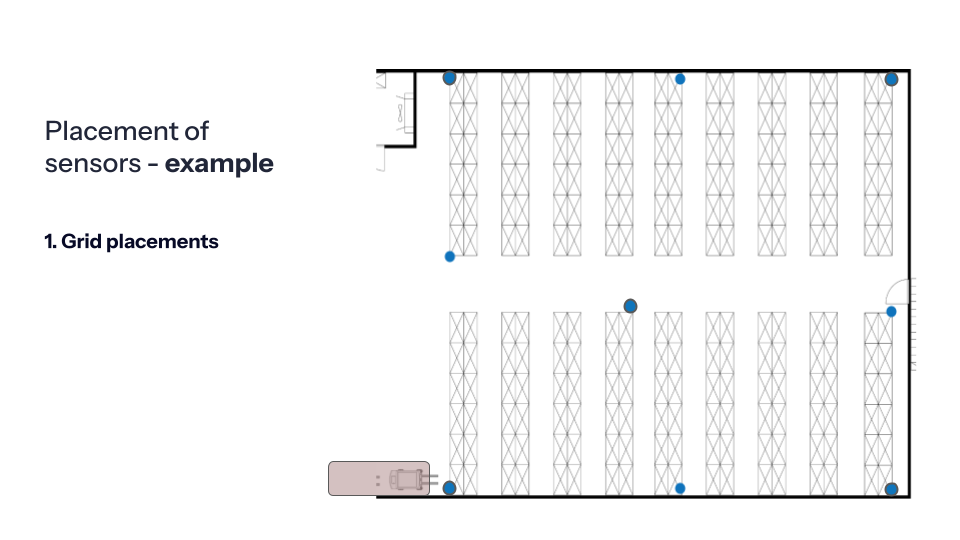 This baseline ensures a compliant and consistent structure for your mapping study.
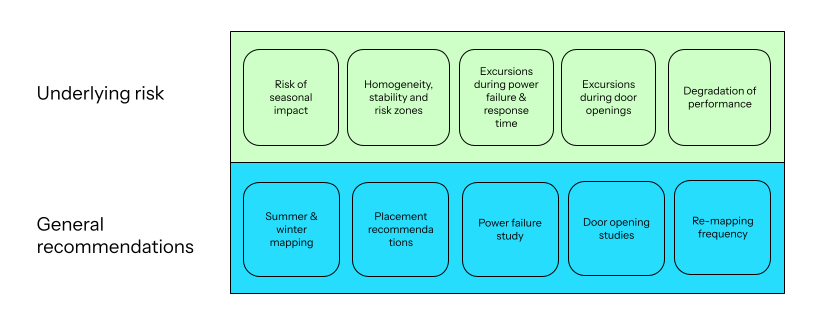
Add risk-based corrections (risk-based placement)
After establishing your grid, add loggers to account for specific risk factors. These fall into three categories:
- Technical risks: HVAC airflow, radiators, fans, door gaps, chargers, lights, or heat-generating equipment
- Operational risks: High-traffic zones, frequent door use, or unpredictable pallet placement
- Compliance risks: Areas where guidelines or past issues indicate added scrutiny
Also read: Guidelines for risk-based temperature mapping in GxP
For example, a loading bay door that opens regularly can introduce thermal fluctuation and regulatory visibility, and an HVAC vent that blows into shelving may skew zone temperatures. Cold or hot spots from previous mappings are also strong candidates.
This framework helps document your logic and ensures each sensor serves a defined purpose.
Use logic to reduce unnecessary sensors
Once your risk-based corrections are added, review the layout for redundancies or overlap. Some examples:
- Can a corner sensor also capture a known airflow risk?
- Are multiple shelves exposed to the same conditions?
- Can horizontal sensors alternate in height to improve vertical coverage?
One effective tactic is height-staggered placement: for example, placing three sensors along a wall at low, mid, and high levels, rather than stacking three vertically in one spot.
This layout reduces total sensor count while still meeting technical and compliance objectives.
Tip! Need input for how to reduce the sensor amount, or any other issue related to temperature compliance? Book at (free) talk with one of our validation specialists to discuss how we can help with your mapping needs.
Include a clear rationale for every placement
Each sensor must have a documented reason for the placement, especially when your setup deviates from guidelines. Auditors will ask, and this is your justification.
Typical rationale types:
- Grid coverage (corners, center, centerline)
- Door or gates
- Airflow risk
- Equipment-related heat risk
- Previous mapping data
- WHO or ISPE compliance
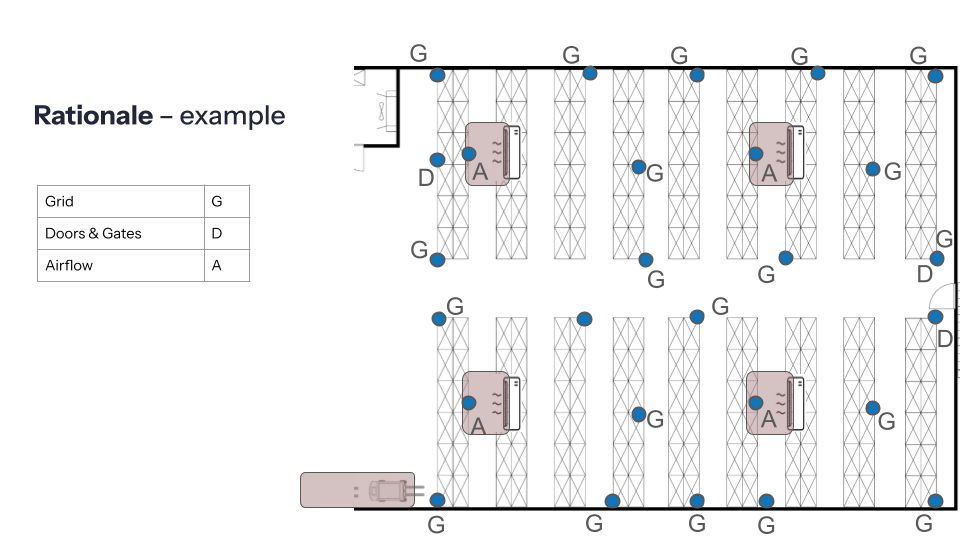
Include these in:
- Your floor plan diagram
- The logger placement table
- A written rationale section in your protocol
Technicians should follow the rationale and not blindly match the map. If the airflow from a vent hits 2 meters to the right of where the dot is placed, that is where the logger should go.
This improves audit readiness and supports replicability across other units or sites.

Video tutorial: Data logger placement
For a more visual and detailed walkthrough of the different rationales, placement strategies, etc., watch our on-demand webinar “Temperature mapping in GxP - data logger placement and amount” right here. Watch tutorial
Common mistakes to avoid when defining data logger placement
- Mapping full rooms instead of just usable volume
- Using a fixed logger count without considering actual risks
- Trusting SOPs without validating how spaces are used in practice
- Applying guidelines without adjusting for real-world conditions
- Skipping rationale or documentation in the protocol

Frequently asked questions about data logger placement in temperature mapping
Do I need to place loggers in areas used for transit?
It depends on both the sensitivity of the goods or samples and the time they will be stored in the area. If goods are stored for more than a few minutes, especially if the area poses a risk of deviation (e.g., near open docks or exterior doors), mapping will often be needed. For very brief transitions, a documented risk justification may be sufficient. In other words, it all comes down to your risk assessment.
Can logger placement affect mapping and audit outcomes?
Absolutely. Poor or unjustified placement – like missing cold/hot spots, failing to cover usable volume, or placing in irrelevant areas – can lead to observations, non-compliance, and costly study redos. Auditors will expect a clear rationale for the placement of sensors.
Should sensor height levels always follow the “top, middle, bottom” model?
Not necessarily. In large spaces, a grid approach may require staggered placement to better capture variation, for instance, alternating between high and low placements across a row. What matters most is capturing vertical variation where it exists.
Do I need to place loggers in empty areas of the room?
Only if those areas are part of the usable volume. If an area is never used and poses no risk, it can be excluded, with proper documentation.
How do I place sensors for warehouse temperature mapping
As with any mapping placement strategy, data logger placement in a warehouse should balance regulatory expectations with actual risks in your storage environment. Follow above-mentioned the four-step approach to determine the best data logger placement for your warehouse.
What should I document when placing data loggers for mapping?
It depends on your requirements, but a rule of thumb is to, for each sensor, document:
- Exact location and height
- Rationale (e.g., cold spot, airflow risk, regulatory coverage)
- Photographic or schematic reference (this builds traceability and supports your rationale during audits or future mappings)
How high should I place my low, middle, and high-level data loggers?
The bottom sensor should be placed at the lowest position where products are stored, for instance, directly on a pallet. Equally, the top sensor should reflect the highest point where goods might be placed, including the shelving height, pallet, and packaging. The middle sensor should be positioned approximately halfway between those two, ideally at the average product height.
What is the recommended distance between sensors in mapping?
There is no single global standard, but WHO and ISPE guidelines offer general rules of thumb. WHO suggests every 10 to 30 meters, depending on room size, while ISPE recommends placements every 9 meters. In practice, use this as a baseline and adjust based on risk factors like airflow, loading zones, or external influences.
Also see: How WHO and ISPE define data logger placement for temperature mapping

What if our chosen monitoring points do not match the cold or hot spots found during mapping?
Your routine temperature monitoring points should reflect the most extreme conditions identified during your mapping study, typically the coldest and hottest areas. If the original points do not align, adjust your monitoring setup accordingly.
How do I identify relevant risks to determine the optimal data logger placement for my mapping?
Start by evaluating three risk categories:
- Compliance risk: Are you meeting WHO/ISPE placement expectations and justifying deviations?
- Technical risk: Are there known variables like HVAC blowout points, charging stations, or door seals that could impact temperature stability?
- Operational risk: Where are products actually stored, even temporarily, and how are people or goods moving through the space?
A clear, documented risk assessment will help guide your sensor placement and support your decisions during audits.
Also read: Guidelines for risk-based temperature mapping in GxP