
How Eupry works: A technical overview
Get a technical overview of the Eupry platform and hardware - from connectivity and calibration workflow to security posture and validation framework. The page is designed for IT, security, and QA teams evaluating our system.
Data loggers
Eupry offers four data loggers, each suited to a different use case:
- Wi-Fi Data Logger: wireless temperature and humidity monitoring for refrigerators, freezers, incubators, and storage rooms. Two-year battery life, AES-128 encrypted data transfer, and a plug-in sensor interface for temperature, humidity, CO2, and differential pressure. Product page
- Screen Data Logger: GxP-compliant logger with a built-in display, real-time audio-visual alarming, and 19-day backup power for cleanrooms, hospital labs, and storage rooms where on-the-wall visibility matters. Product page
- Smart Shipment Tracking Label: GDP-compliant smart label with cellular tracking for temperature, humidity, location, shock, and light during shipment. Single-use with a one-year shelf life. Product page
- Airplane Data Logger: FAA-approved compact logger with aviation-compliant connectivity for aircraft temperature mapping, with automatic data offload on the ground. Product page
The rest of this page focuses on the Wi-Fi Data Logger, which is the platform's primary deployment across labs, warehouses, and most facility-monitoring applications. The Smart Shipment Tracking Label and Airplane Data Logger feed into the same Eupry platform for shipment and aircraft use cases (see Dual Compliance Platform).

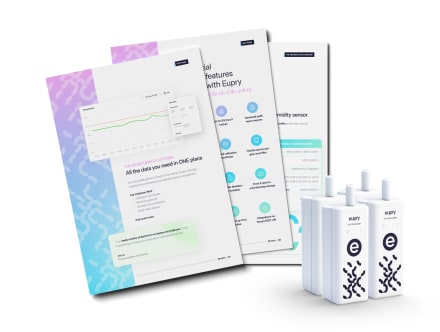
Download a product catalog
Prevent mistakes and stop the hunt for data with automated monitoring built for GMP, GDP, and other GxP industries. See how it works our catalog.
The Wi-Fi Data Logger
The Wi-Fi Data Logger is built around a single base unit that runs across all facility-monitoring use cases. The same hardware monitors a +5°C (41°F) refrigerator, a -80°C (-112°F) freezer, or a cleanroom requiring differential pressure. The base unit handles power, on-device storage, transmission, and sensor recognition. Sensors are a separate, plug-in component – calibrated and held in stock independently and connecting through a 2.5 mm 4-pole interface, essentially an audio jack. This separation is the foundation for several capabilities covered below: on-the-wall calibration without taking the device offline, sensor swap as the routine maintenance event, and a single hardware platform that supports temperature, humidity, CO2, and differential pressure monitoring across applications.
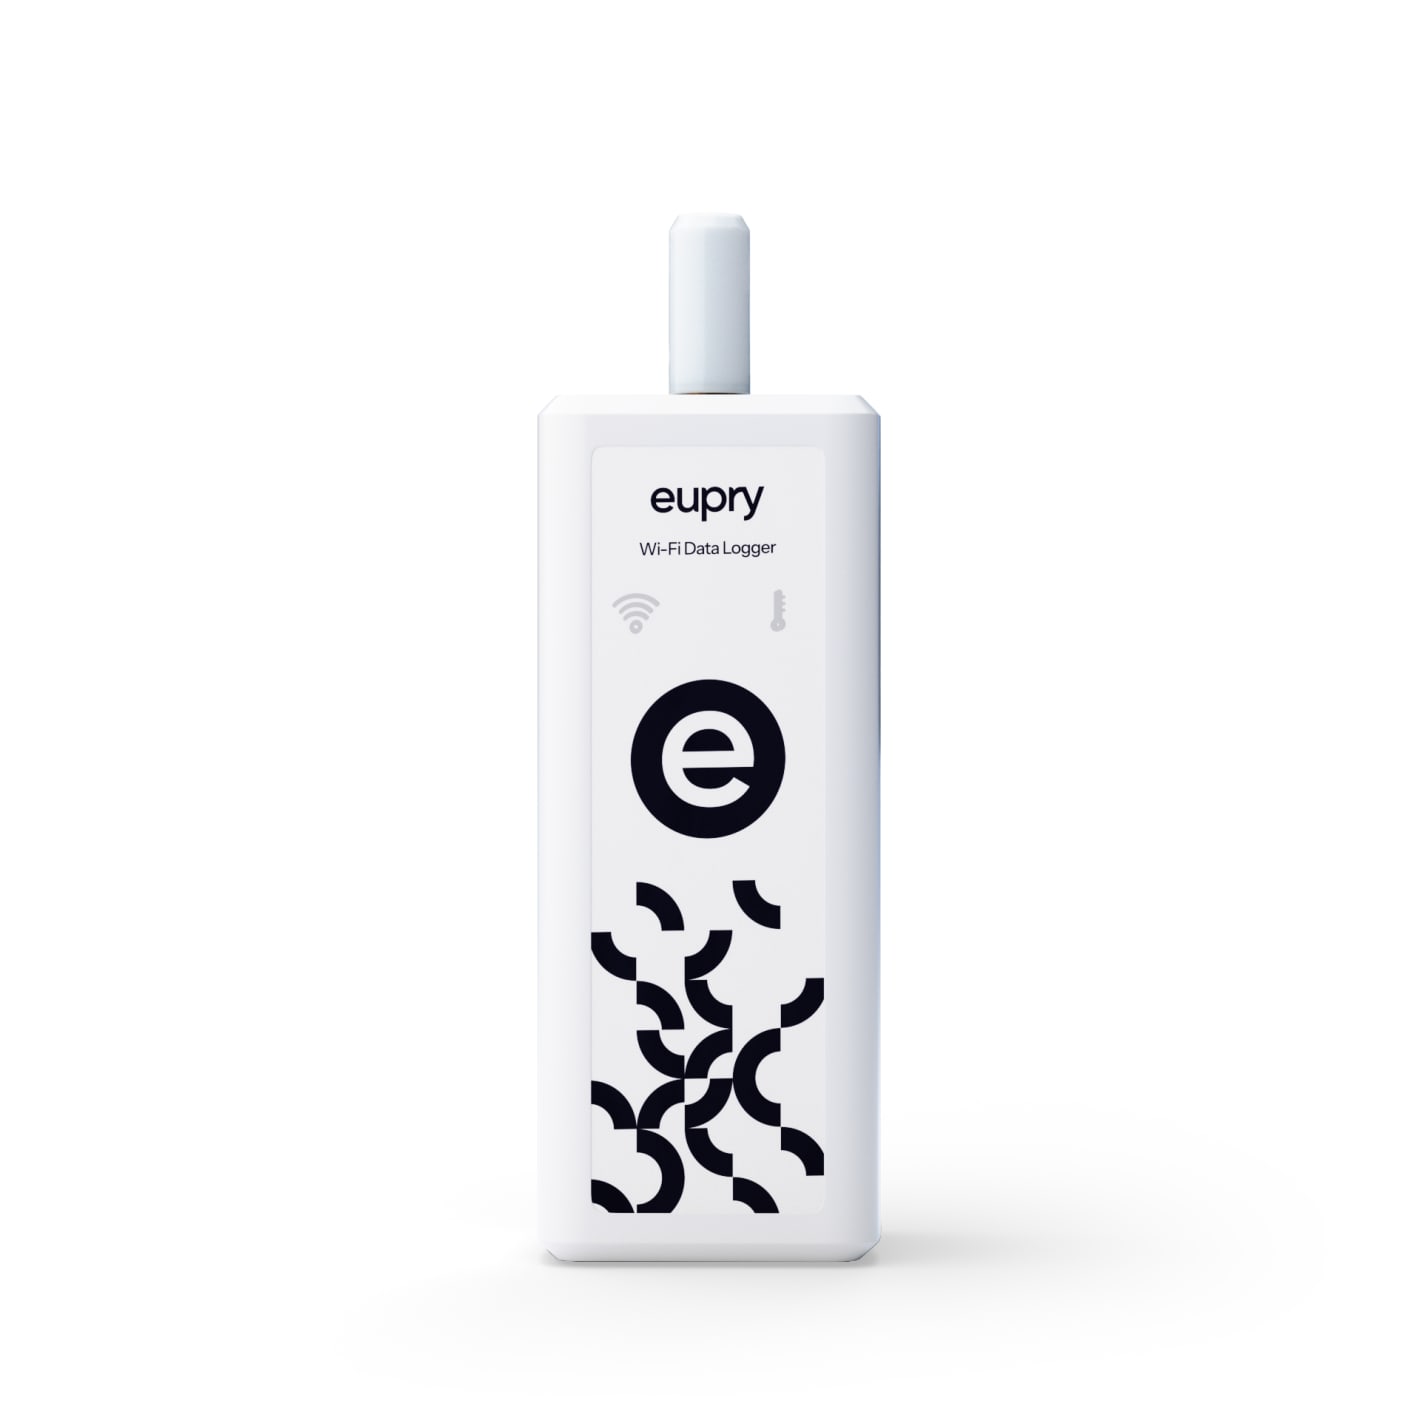
Single-button design
The logger has one physical button and a display showing WiFi and temperature status. All configuration – measurement intervals, alarm thresholds, logger grouping, naming, alarm recipients – is managed in the Eupry Compliance Platform, not on the device. A facility manager can update thresholds, intervals, or alarm recipients for hundreds of loggers from a desk, without walking the floor.
Press the button to force a data sync when the logger is in range of a router. Everything else happens automatically or through the platform. Initial setup is handled via the Eupry Connect app, available for iPhone and Windows, which can configure multiple loggers at once.
Physical dimensions
The logger measures 91.5 mm x 37 mm x 33 mm and weighs 83 g with batteries. It is compact enough to sit between shelves inside a standard refrigerator or freezer without obstructing airflow. The casing is ABS polymer.
Battery life
The logger runs on two AA lithium batteries, with battery status reported in the platform. Eupry's standard estimation is based on a 3-minute measurement interval with 4 data transmissions per day, at which the logger runs for approximately two years. Higher measurement frequencies or more frequent transmissions reduce battery life proportionally.
Local storage
Each logger stores up to 10,000 measurements locally. The local buffer operates as a rolling buffer: when 10,000 measurements are reached, the logger overwrites the oldest measurement first. There is no recording cutoff in normal operation.
At a 1-minute interval, 10,000 measurements cover approximately 7 days before the buffer rolls over. At a 5-minute interval, approximately 35 days.
Resilience to network and power failure
Local storage protects against two failure modes that pharma compliance reporting typically asks about.
Network failure. If WiFi drops or a router loses power, the logger continues recording at its configured interval. When connectivity is restored, locally stored measurements are uploaded to the platform automatically.
Power failure at the monitoring location. Because the logger runs on its own batteries, a power outage at the monitoring location does not stop recording. Data continues to be logged through the outage and is transmitted once connectivity returns.
A documented monitoring record holds across both failure scenarios without manual recovery.
Sensors and parameters
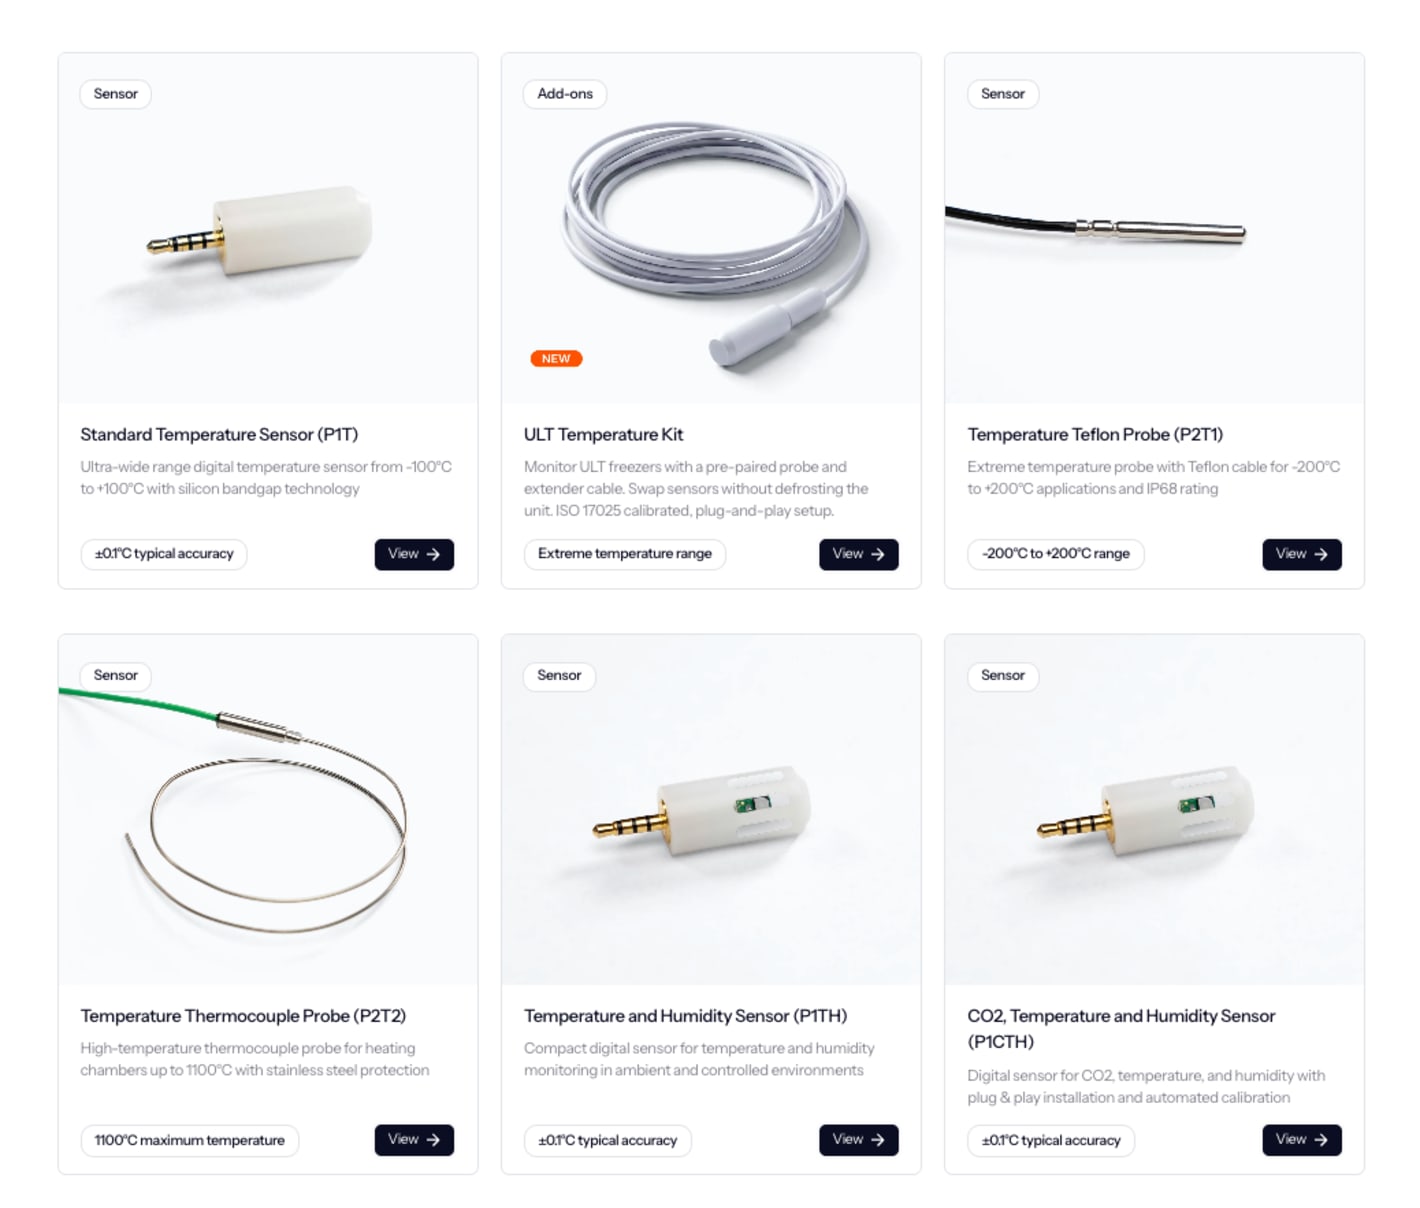
The Wi-Fi Data Logger supports a family of plug-in sensors for temperature, humidity, CO2, and differential pressure. All sensors share the same 2.5 mm 4-pole interface, the same automated calibration model, and the same platform integration. Calibration data follows the sensor – swap a sensor, and the platform links the new calibration certificate to the correct monitoring point automatically.
The sensor family includes compact plug-in probes for standard refrigerators and incubators, extended-cable probes for door-pass installations into sealed units, Teflon and thermocouple probes covering -200°C to +1100°C across the range, high-precision humidity probes, and a differential pressure sensor for cleanrooms and HVAC monitoring.
For the full sensor catalog with technical specifications, see the products page or download a product catalog.
Connectivity
Eupry supports two connectivity models. The choice is driven by the customer's IT environment and the deployment scale.
Eupry-provided 3G/4G router (default)
In most deployments, loggers connect to a standalone Eupry router that creates an independent WiFi network for the loggers and connects to AWS via cellular (4G LTE, with 3G/2G fallback). The router operates independently of the building's network, does not interfere with existing IT infrastructure, and does not require coordination with the customer's IT team to set up, which removes a common dependency on the building network being available, correctly configured, or open to IoT devices on a particular VLAN.
Cellular 3G/4G/5G networks reach approximately 96% of the global population (ITU Facts and Figures 2025), which means the router works in most deployment locations without site survey or local IT involvement.
Customer's existing WiFi
For customers who prefer to run loggers on their own infrastructure, the platform supports connection to the customer's WiFi (2.4 GHz, 802.11 b/g/n). In this model, capacity is bounded by the customer's network – specifically, the DHCP lease pool and how IP leases are managed. Most enterprise networks handle this without issue. Larger deployments should be reviewed with the customer's IT team during planning.
Data flow and transport security
Loggers transmit via WiFi 2.4 GHz (802.11 b/g/n). All communication is initiated by the logger as an outbound connection to Eupry's cloud – the logger does not expose listening services or accept inbound connections, which means there are no open ports on the device for an external attacker to reach. Logger-to-cloud traffic is encrypted at the application layer with a device-specific AES-128 key. Browser and API traffic uses HTTPS with TLS 1.3. Each logger is authenticated by its unique GS1 GRAI code and a 32-character token – both must match the server before any communication is accepted. Data-at-rest, subprocessors, and infrastructure security are covered under Security below.
Router capacity and sizing
For most deployments, a single Eupry router covers a single facility or zone. Larger sites use multiple routers, and placement is driven by physical layout – distance, concrete walls, RF interference – more than by raw logger count. Eupry sizes router capacity per site during deployment planning to accommodate the size and structure of the facility.
The Eupry platform
The platform is where measurement data is stored, displayed, configured, and reported on. The loggers record and transmit; everything beyond that – visualization, alarming, audit, reporting, calibration certificate storage – lives in the platform.

Hierarchy: locations, profiles, loggers
The platform organizes monitoring around a three-level hierarchy: locations (sites or buildings), profiles (rooms, equipment, or process areas), and loggers (individual monitoring points). The same hierarchy supports a single lab, a multi-building campus, and a global multi-site deployment without changes to the operating model.
Configuration changes – measurement intervals, thresholds, alarm recipients – can be applied at any level: to a single logger, to all loggers in a profile, or across an entire location. User permissions follow the same hierarchy.
Data display
Measurement data is displayed as a time series with automatic graphing. The platform distinguishes between raw data (the measurements themselves) and reports (deliverables built from that data – mapping reports, audit reports, calibration certificates, compliance summaries).
The platform handles both. Raw data is available in the interface and via export. Reports are generated by the platform without manual data export, formatting, or compilation.
Measurement and upload intervals
Two intervals govern how often data moves from device to platform: the measurement interval (how often the logger records a reading) and the upload interval (how often those readings are transmitted to the cloud). Both affect battery life.
Measurement interval is customer-configurable in the platform, from 30 seconds to 15 minutes (the available range depends on the software plan), and can be changed remotely without physically touching the device. Different applications need different intervals. An open-door test on a small refrigerator might justify a 30-second interval to capture transient excursions. Continuous monitoring of a stable warehouse is typically configured with a longer interval to extend battery life.
Upload interval is managed at the platform level rather than configured per device. The standard cadence is approximately four transmissions per day, which is what most monitoring use cases need and what Eupry's battery estimates are based on. For applications that need higher-frequency uploads – live dashboards, real-time alarming, or rapid-response monitoring – the Live Data Hub uses ESP-NOW protocol to deliver near-real-time data without the battery cost of frequent cellular transmission.
Alarm logic
Eupry uses a two-tier threshold system per monitoring point.
Critical limits. A single out-of-spec measurement triggers an alarm immediately. Used for hard regulatory limits where any excursion needs investigation.
Grey zones. Configured as a sustained excursion with a timeout – for example, "above 8°C for 30 minutes." The alarm triggers only when the condition holds for the configured duration. This filters out transient excursions like door openings or defrost cycles, where the temperature recovers before there is any product impact.
Both critical limits and grey zones can be configured independently as HIGH and LOW thresholds. A single monitoring point can therefore have a hard upper limit, a hard lower limit, an upper grey zone, and a lower grey zone – each generating the appropriate alarm without manual filtering.
Alarms are delivered via SMS and email to designated users.
Audit trail and data integrity
Recorded measurement data cannot be edited or deleted. Data flows from logger to platform without manual intervention – the device records the raw measurement, and the platform receives and stores it. There is no manual data entry step, and no path to alter recorded values after the fact.
The platform includes a dedicated FDA 21 CFR Part 11 module with audit trail functionality and electronic signatures. Every change to configuration, thresholds, alarm recipients, or user access is logged with timestamp, user, and reason for change.
Calibration certificates
Calibration certificates issued by Eupry's labs are uploaded to the platform automatically and linked to the monitoring point where the sensor is installed. Customers do not store certificates separately. The platform maintains a historical record of every sensor that has been used at every monitoring point, alongside the data those sensors recorded.
Continuous recording
There is no need to define a recording start or end time. Once a logger is configured and placed, it records continuously. The logger begins transmitting as soon as it connects to a router and continues recording locally if that connection is interrupted. For session-based reporting – mapping studies – see Mapping and monitoring below.
Calibration
Calibration standard
Calibration of all Eupry sensors is performed in Eupry's own labs under ISO 17025 accreditation. The accreditation is issued by DANAK, a signatory to the ILAC Mutual Recognition Arrangement, which means the calibration is internationally recognized and accepted by regulators and auditors in markets that follow the ILAC MRA.
Standard ISO 17025 accredited calibration covers -30°C to +50°C (-22°F to 122°F). For ultra-low temperature applications, an extended range of -80°C to -10°C (-112°F to 14°F) is available under the same accreditation.
For temperatures outside these standard ranges, Eupry offers custom calibration services: from -100°C to +75°C (-148°F to 167°F) in Eupry's own lab, or from -196°C to +200°C (-321°F to 392°F) through accredited external partner labs. Applications like ultra-low freezer mapping at -80°C and incubator monitoring around +60°C are fully covered.
When recalibration is performed
Recalibration is typically driven by one of three triggers.
Protocol-driven. A customer's quality protocol or validation plan specifies a recalibration interval – for example, every 6 or 12 months, depending on the application and risk class.
Drift-based. A documented drift event during use – observed in monitoring data or flagged at end-of-use verification – triggers recalibration of the affected sensors. For reference: in third-party testing by Teknologisk Institut, the P3TH humidity probe was cycled for 15 days between 7% and 90% RH and -30°C to +60°C; end-of-test drift fell between 0.17% and 0.8% RH, within the ±1.0% calibration MPE.
Annual fallback. As the longest acceptable interval in most pharma quality systems, an annual recalibration cycle is the default fallback when no shorter protocol-driven interval applies.
The platform tracks the last calibration date and accreditation reference for every active sensor and supports the customer's chosen recalibration cadence.
How recalibration works: the on-the-wall sensor swap
Traditional recalibration means removing the device from its monitoring point, sending it to a lab, waiting for it to return, and placing a spare in the gap. With Eupry, the logger stays where it is.
Eupry's patented Aliio technology separates the sensor from the logger. When recalibration is performed, Eupry ships newly calibrated sensors to the customer's site. The technician unplugs the old sensor and plugs in the new one – at the monitoring point, without taking the logger offline. The platform recognizes the new sensor and links the new calibration certificate to the correct monitoring point automatically.
The process takes seconds per device. The used sensors are returned to Eupry, where they are recalibrated and either retained in inventory for the next swap cycle or returned to the customer.
See how the calibration solutions work.
Also read: On-the-wall calibration: How does it work?
Express end calibration: post-mapping verification without on-site dry blocks
Many GxP processes require post-mapping verification – a second calibration that confirms the sensor's accuracy did not drift during the measurement period, validating the recorded data. The industry default is on-site post-verification in dry blocks. This is workable for a handful of sensors but impractical at the volumes typical of large mapping studies, where 20 or more sensors are in use simultaneously.
Eupry's express end calibration service removes the on-site step. Because sensors are calibrated independently of the logger and held in calibrated stock, customers receive two sensors per logger from the start. After a mapping study is completed, the used sensor is swapped on the wall for a calibrated spare from local stock – no dry-block setup, no monitoring gap. The used sensors are returned to Eupry, end-calibrated under ISO 17025 accreditation, and the results are uploaded to the platform – typically within five working days. Newly calibrated sensors are then sent back to replenish local stock for the next study.
The result is a documented pre-use and post-use calibration record for every sensor in the study, with no on-site verification work and no downtime at the monitoring point.
Mapping, monitoring, and CMM
The platform supports both temperature mapping, real-time monitoring, and continuous mapping and monitoring. The hardware and platform are the same – what changes are the protocol and report format.
Temperature mapping with our mapping software
Eupry's mapping software automates the data transfer from loggers during a mapping study. It tracks parameters during live studies and generates structured mapping reports including summary tables with min/max/mean values, standard deviation, homogeneity calculations, and hot and cold spot identification.
Mapping data lives in the platform alongside monitoring data, but the workflows are distinct. The software handles data automatically – there is no step where raw data needs to be exported to Excel for analysis, reformatted, or manually compiled into a report.
See how the mapping solutions work.
Multi-zone mapping
Mapping a room with multiple zones – for example, a warehouse with both ambient and cold storage areas – uses multiple loggers, each placed at a defined monitoring point. Each logger measures one location. The mapping software collects all the data, and the report covers the full space. The number of loggers and their placement are defined by the mapping protocol and a risk assessment specific to the facility.
Real-time monitoring
Both mapping and monitoring workflows run in the same platform, and the same data loggers as used for mapping are designed to be used for environemental monitoring. You simply keep (some of) the loggers in place and switch the software. Each logger records at its configured measurement interval, transmits to the platform, and triggers alarms when your defined limits are breached (see Alarm logic above). As a user you can access current and historical data, trend analysis, and audit-ready records through the same platform.
See how the monitoring solution works
Continuous Mapping and Monitoring (CMM)
For facilities that want to eliminate periodic re-mapping, Eupry's Continuous Mapping and Monitoring (CMM) approach uses strategically placed loggers for continuous monitoring at a density that satisfies both monitoring and mapping requirements simultaneously.
The initial mapping study establishes the baseline. After that, the continuous data stream from those same loggers serves as ongoing re-validation – there is no need to schedule disruptive re-mapping exercises. The approach requires a risk assessment to determine logger placement and density, and it changes the operational model from periodic snapshots to always-on compliance.
In large warehouses and distribution centers, the operational case for CMM is more concrete than the regulatory one. A traditional mapping study in a high-bay warehouse means scissor lifts, hours of setup at every monitoring point, the same hours of takedown afterwards, and a study that has to be repeated on a fixed cadence. Continuous monitoring at mapping density places the loggers once, then keeps them there. The setup-takedown cost is paid once, not every cycle.

Scaling across sites
Many monitoring devices on the market output data as raw CSV time series. The downstream work is the customer's: download the CSVs, paste into Excel, and rebuild the same report format that the team has built a thousand times before. The Eupry Compliance Platform handles that step. Mapping reports, audit reports, and compliance summaries are generated in the platform from the same underlying data, in the same format, every time – the "download and rebuild" step is removed from the workflow.
How the hierarchy scales
The platform's locations → profiles → loggers hierarchy is what makes this work at scale. Alarm rules, threshold configurations, and recipient lists are set at the level they apply to – facility-wide policies at the location level, equipment-specific rules at the profile level, individual exceptions at the logger level – rather than rebuilt for each device. Reports inherit the same structure: a single cross-site compliance summary, a per-facility audit report, or a per-equipment mapping report comes from the same data and the same hierarchy without manual reorganization. As the deployment grows from 10 loggers to 1,000, the operating model does not change.
Why it matters
For consulting teams and large quality organizations, this is often a critical-path issue. Temperature data is frequently the last input to land in a trial report, a supply chain compliance report, or a batch release – and the team responsible for it is often the bottleneck the rest of the process is waiting on. Reducing the time from raw data to delivered report removes a common compliance blocker.
Security
Logger device security
The Eupry data logger is a purpose-built device with a small, well-defined attack surface. It runs on a microcontroller, not a general-purpose operating system like Linux or Windows, which means the OS-level exploit paths that affect many consumer IoT devices are not present. There is no remote management interface, no login surface, and no unnecessary services or ports. The logger is designed for the least functionality: recording measurements and transmitting them to the Eupry cloud.
Because all cloud communication is initiated by the logger as an outbound connection (see Connectivity), there are no open inbound network ports. Each logger has unique per-device credentials, and firmware updates are digitally signed and verified before installation. This is a meaningful distinction from consumer IoT devices – network cameras, smart-home hubs, connected appliances – whose exposed management interfaces are the typical target in high-profile IoT compromises.
Network security
Logger traffic is contained within the deployment model. When using the Eupry-provided router, loggers communicate on a network independent of the customer's IT infrastructure. When using the customer's WiFi, loggers authenticate with a unique GS1 GRAI code and a 32-character token – both must match the server before the platform accepts any communication.
Data from the loggers to Eupry's cloud is encrypted at the application layer with a device-specific AES-128 key derived from the token. Separately, all browser and API traffic between the platform and the user runs over HTTPS with TLS 1.3. For specific software plans, HTTPS can also be enabled on top of AES-128 for logger traffic (requires firmware 1.5.2 or newer; arranged through Eupry support).
The platform sits behind Cloudflare's Web Application Firewall and Content Delivery Network, which handles DDoS protection, edge caching, and a baseline layer of application-level filtering.
Data security
Data at rest in AWS is encrypted with AES-256 using S3 Server Side Encryption, with master keys rotated at least monthly. Backups run nightly (full) with incremental backups during the day, stored across three locations. AWS S3 provides 99.999999999% durability for the storage layer.
Data retention is plan-dependent and ranges from 3 to 30 years.
The platform supports role-based access control with four named levels – Viewer, User, Admin, and Owner – which the customer's administrators configure for their own users. Single Sign-On is supported: Eupry connects to the customer's existing SSO provider (for example, Microsoft Entra, Okta, or Google Workspace), which means the customer's organization controls authentication rules, including multi-factor authentication (MFA). MFA is enforced through SSO configuration, not managed separately in Eupry. No default or generic accounts exist – every user is individually provisioned, with deprovisioning within one business day of termination.
User passwords are hashed with Argon2 – a modern, memory-hard algorithm designed for resilience against brute-force and GPU/ASIC-accelerated attacks. Eupry personnel cannot read user passwords. Application secrets and API keys are managed through AWS Secrets Manager with automated rotation.
Infrastructure security
Eupry is hosted on AWS in Ireland (EU), with backup facilities in central Europe. AWS Availability Zones provide redundancy against single-site failure. The platform is multi-tenant.
Security monitoring uses AWS CloudTrail and CloudWatch, enriched with AWS GuardDuty for real-time threat detection, with automated alerts routed to the operations team.
Eupry holds ISO 27001:2022 certification for information security management and conducts annual third-party penetration testing – each time with a different vendor to provide a fresh perspective.
Subprocessors
The platform uses the following subprocessors for production services:
- Amazon Web Services: cloud hosting and storage
- Cloudflare: Web Application Firewall and Content Delivery Network
- Mailgun (Sinch): email delivery for alarms and notifications
- Twilio: SMS delivery for alarms
For full subprocessor documentation, including risk assessments and contractual security obligations, and for other security documentation – policies, SOPs, business continuity and disaster recovery plans, incident response process, and audit Q&A – see the Eupry Trust Hub.
Compliance and validation
21 CFR Part 11
The platform includes a dedicated FDA 21 CFR Part 11 module covering audit trail, electronic signatures, and the technical controls for data integrity discussed under The Eupry Compliance Platform above.
EudraLex Annex 11
For EU markets, Eupry documents compliance with EudraLex Volume 4 Annex 11, the EU equivalent of 21 CFR Part 11. Annex 11 documentation is available through the trust hub.
Software change control and supplier qualification
The platform is developed and released under a documented change management and qualification framework. The full set of supplier documentation – Change & Configuration Management Program, Changes Notification & Verification process, and Qualification approach – is available in the Eupry Trust Hub and supports customer-side validation activities.
Customer audit support
Eupry supports customer audits. Audit Q&A, SOPs, and supporting documentation are available through the trust hub. Direct supplier audits can be arranged through Eupry support.
Eupry has taken a proactive quality approach, which means that we will always respond to questionnaires within 24 hours and have an audit preparation package available for interested customers. Furthermore, the trust hub updates allow all customers to receive updated certification certificates when they are updated without having to ask for them.
Continuous compliance approach
Integrating a continuous temperature mapping framework transforms compliance from a disruptive, periodic snapshot into an integral part of daily operations. While traditional thermal validation provides a point-in-time assessment requiring resource-intensive re-mapping every few years to check for system degradation, continuous mapping establishes a permanent monitoring foundation that eliminates the need for cyclical re-validation unless operational or facility changes alter the airflow.
Continuous temperature mapping framework
Continuous temperature mapping (also referred to as ongoing verification or continuous qualification) shifts the paradigm from point-in-time snapshot testing to a state of permanent performance verification. By integrating an expanded, high-density matrix of permanent data loggers into daily operations, this framework ensures that environmental control systems are validated dynamically under real-world stress conditions.
Structural design and risk-based topology
The framework relies entirely on an advanced risk assessment to dictate the quantity and spatial coordinates of permanent data loggers, categorizing environmental risks into three primary vectors:
- Compliance risks: ensuring the system constantly captures internal hot and cold spots to maintain an audit-ready state aligned with international standards such as EMA, FDA, and PIC/S guidelines.
- Technical risks: mapping the exact layout of forced air convection, ventilation outlets, control sensors, and structural thermal bridges to prevent localized hot or cold pockets.
- Operational risks: capturing the real-time transient impacts of high-activity operational workflows, including recurring door openings, loading/unloading configurations, and machinery heat generation.
Traditional vs. continuous monitoring footprint
In a typical traditional monitoring setup, a facility utilizes a low-density sensor footprint (e.g., 5 data loggers) to track absolute extremes identified during an initial, temporary study, requiring a full breakdown and re-study using dozens of loggers years later. The continuous mapping framework replaces this cycle by permanently installing a high-density sensor grid (e.g., 15 to 20 data loggers in smaller setups, or proportional expansions for larger spaces) directly inside all critical risk zones.
Core engineering and operational benefits
- Automated compliance: eliminates manual data compilation and periodic re-validation schedules by providing automated, ongoing insights into facility performance.
- Operational continuity: removes the standard operational disruptions and facility lockouts associated with repeating full-scale empty and loaded validation studies.
- High-resolution datasets: enables granular trend analysis and predictive maintenance optimization by moving beyond restrictive, single-point data collections.
- Change-driven re-validation: restricts full re-mapping protocols strictly to major structural modifications, such as physical reconfiguration of internal racking systems, raw material composition shifts affecting thermal mass, or central HVAC control system upgrades.
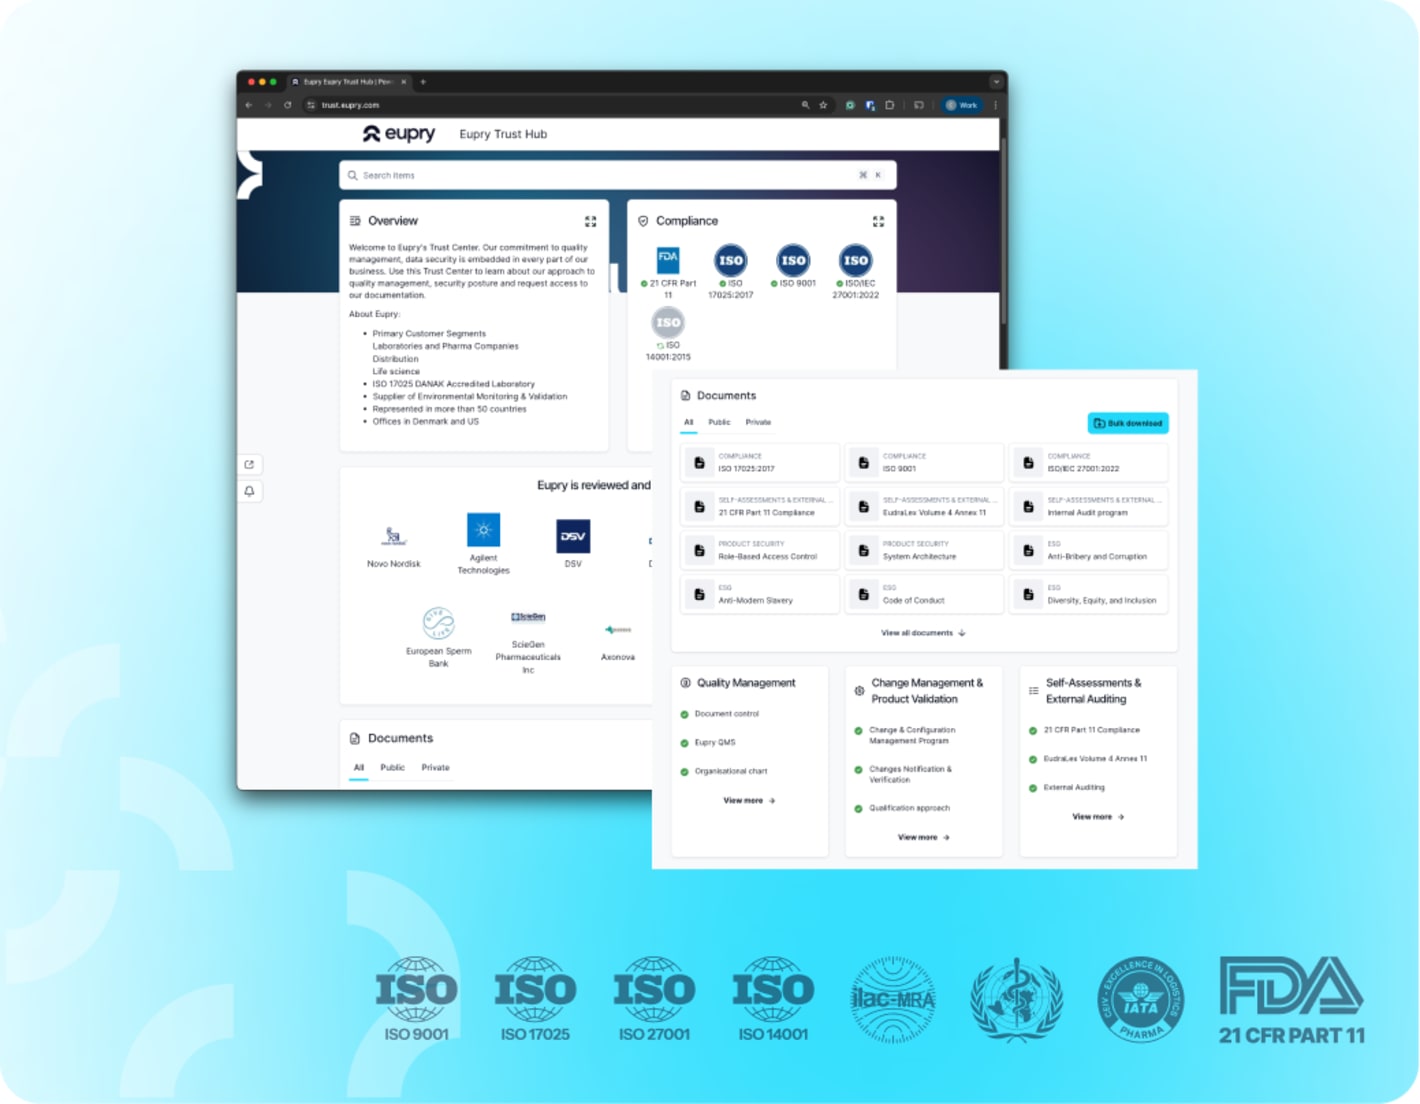
The Eupry Trust Hub
All compliance documentation in one place
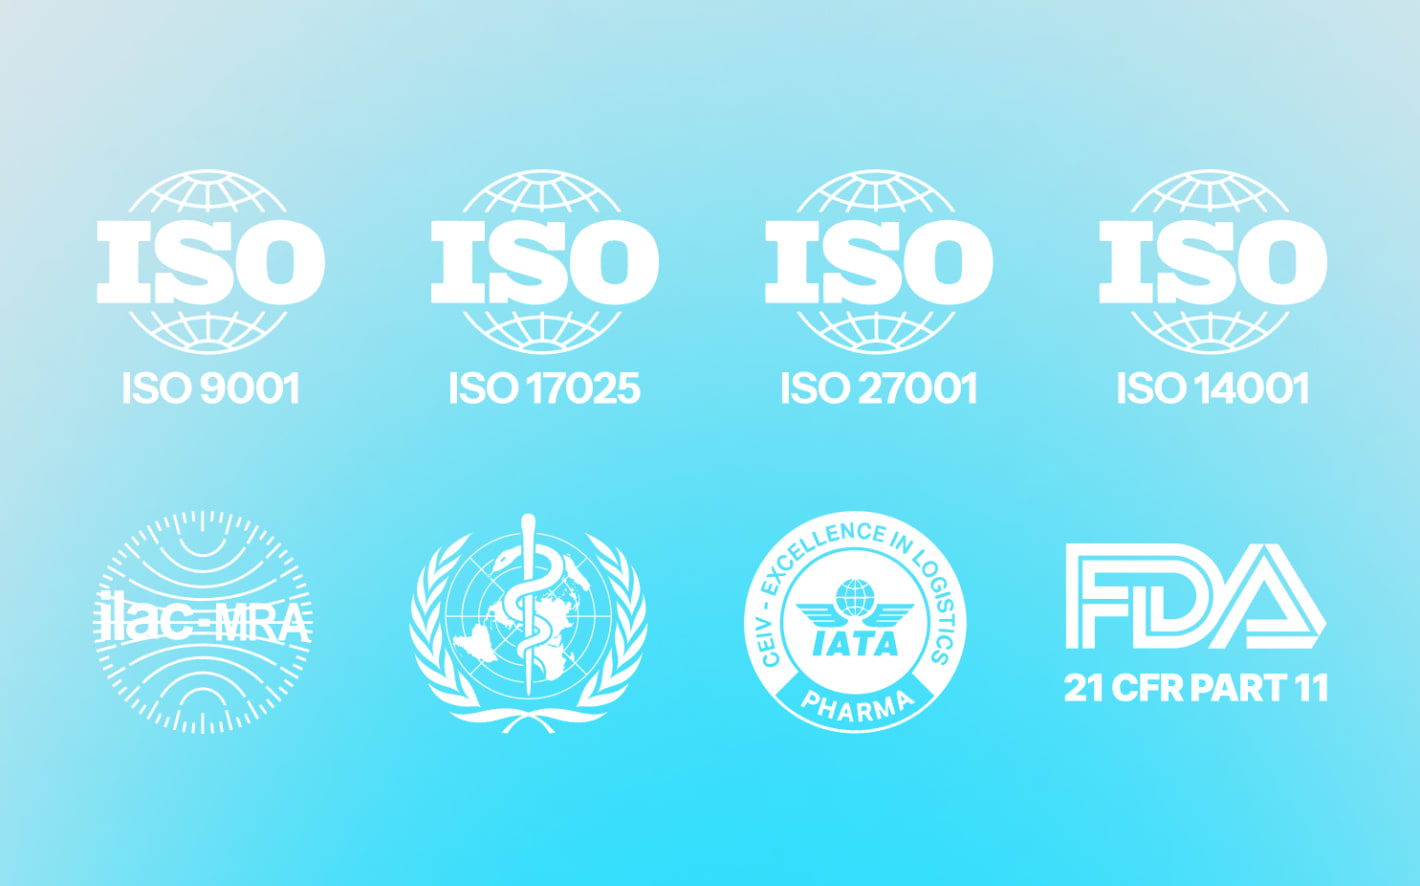
We understand that vetting a new GxP partner involves a lot of questions. The Trust Hub is designed to make that process faster and easier. It gathers all the information you need to assess our compliance and processes – from accreditations, certifications, and quality management approach to how we handle data security.
Integrations
Connecting to your existing systems
Facility management systems (FMS), building management systems (BMS), and building automation systems (BAS) are typically the backbone of environmental compliance in pharma facilities. The Eupry platform is designed to connect to these systems through its REST API, so temperature and environmental data can flow into the same operational picture the facilities team already uses, rather than living in a separate silo.
Beyond FMS/BMS/BAS, the platform also integrates with data analysis and business intelligence tools of the customer's choice, including Power BI, custom dashboards, and internal reporting systems.
For specific integration questions – including which platforms Eupry has connected to in current customer deployments – contact us here, and we'll send over the relevant info.
REST API
Eupry provides a REST API for programmatic access to monitoring data. Authentication is handled via a bearer token issued to a user account. API access is available on Premium and Enterprise software plans.
For API documentation, endpoints, authentication details, and integration examples, request access here – our team will share documentation and support your implementation.
Data export
All plans support PDF and CSV exports of monitoring data, audit reports, and calibration certificates.

Send us a message
Need more information? We are here to help. Let us know what you are looking for, and we will get back to you as soon as possible.
Questions and answers about Eupry
See how it works
Download our product catalog for detailed specifications on loggers, sensors, and platform capabilities.